


From Excel-Based DGR Reporting to TIYA Based MIS
Renewable energy portfolios have expanded rapidly — and operations teams are now managing multiple sites, hundreds of inverters, daily generation reports, and portfolio-level MIS across distributed teams. Yet many companies still rely on Excel sheets, email approvals, and manual DGR consolidation. What worked for a few sites quickly becomes unmanageable at scale.
THE CHALLENGE
Renewable Operations Are Scaling Faster Than Reporting Workflows
Operations teams are now managing multiple sites across regions, hundreds of inverters, Daily Generation Reports, SCADA inputs, downtime records, PR and CUF tracking, portfolio-level MIS, and cross-team coordination — yet the reporting infrastructure hasn’t kept pace.
“Operations teams spend more time consolidating reports than actually analyzing performance.”
OPERATIONAL IMPACT
The Excel Problem Every Renewable Operations Team Understands
The daily workflow is the same across most teams — Excel files, missed entries, late reports, and decisions made on outdated data. Here’s what that costs operationally:
| Pain Point | Operational Impact |
|---|---|
| Delayed reporting cycles | MIS reaches management too late for action |
| Missing entries | Missing entries leads to incorrect performance analysis |
| Inconsistent DGR formats | No standard view across sites or periods. Different names for same breakdowns in excel |
| Limited portfolio visibility | Hard to compare plants or spot trends |
| Manual reporting errors | Wrong numbers in MIS and leadership discussions |
| Slower decision-making | Decisions based on outdated or incomplete data |
| Fragmented operational tracking | No single source of truth for plant/inverter performance |
| Excel crashing issue | After collecting long duration of data Excel gets hang or crash quite often |
THE REAL PROBLEM
The Challenge Was Never Just Reporting — It Was Visibility
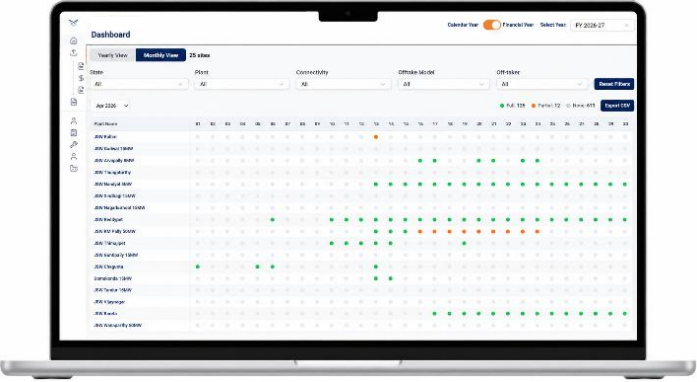
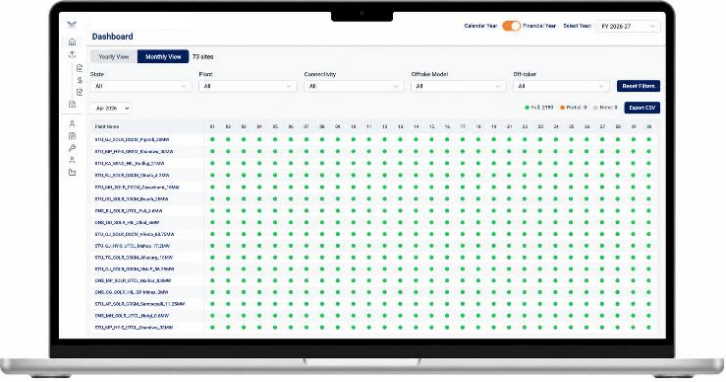
Operations teams often struggled to answer basic questions quickly: Which sites have incomplete DGR submissions? Which plants are delayed? Which inverter entries are missing or incorrectly entered? What is the actual generation loss today?
Finding these answers required calling multiple site teams, reviewing spreadsheets, and consolidating data manually. By the time reports reached management, operational decisions were already delayed.
Which sites have incomplete DGR submissions?
No centralized visibility meant operations managers had to call each site individually — a process that could take hours.
Which inverter and breakdown entries are missing?
Inverter-level data lived in separate sheets, making it nearly impossible to spot gaps without a manual audit. Breakdown entries are not provided properly.
Which sites are underperforming against PR targets?
PR and CUF comparisons required assembling data from multiple sources — time-consuming and prone to errors.
Where are the operational bottlenecks?
Without a unified view, identifying which sites or processes were slowing down the reporting cycle was largely guesswork. Calculating MTTR and MTBF is a chaos.
What was my last 5 years performance?
Large timeline data set provides behavior rest all is guesswork. Without a unified DGR for all years in one it is nearly impossible to compare day-to-day or month-to-month performance trends of the plant. Hence without comparing trend behavior changes in plant cannot be detected easily.
How do I make new input in DGR format for all my site quickly?
Without a unified place for making changes in DGR so that it can be communicated to site team without the need of working on their excel files separately, is a nightmare for MIS team. One new insight which requires a new input or new sheet in excel becomes a mission rather than ease.
THE SOLUTION
The Shift Toward Centralized Renewable Operations
The goal was never just to build another dashboard, the goal is give the complete analysis of plant with real insights just like a performance analyst looks into it to the site team quickly with DGR submission without waiting for any entire day. The real objective was to simplify how renewable operations teams actually work. That journey led to TruGreen FlowLite — a centralized renewable operations platform designed to replace disconnected spreadsheets and fragmented workflows with one connected system.
PLATFORM CAPABILITIES
What FlowLite Centralizes for Operations Teams
Centralized Plant-Level Reporting Workflows
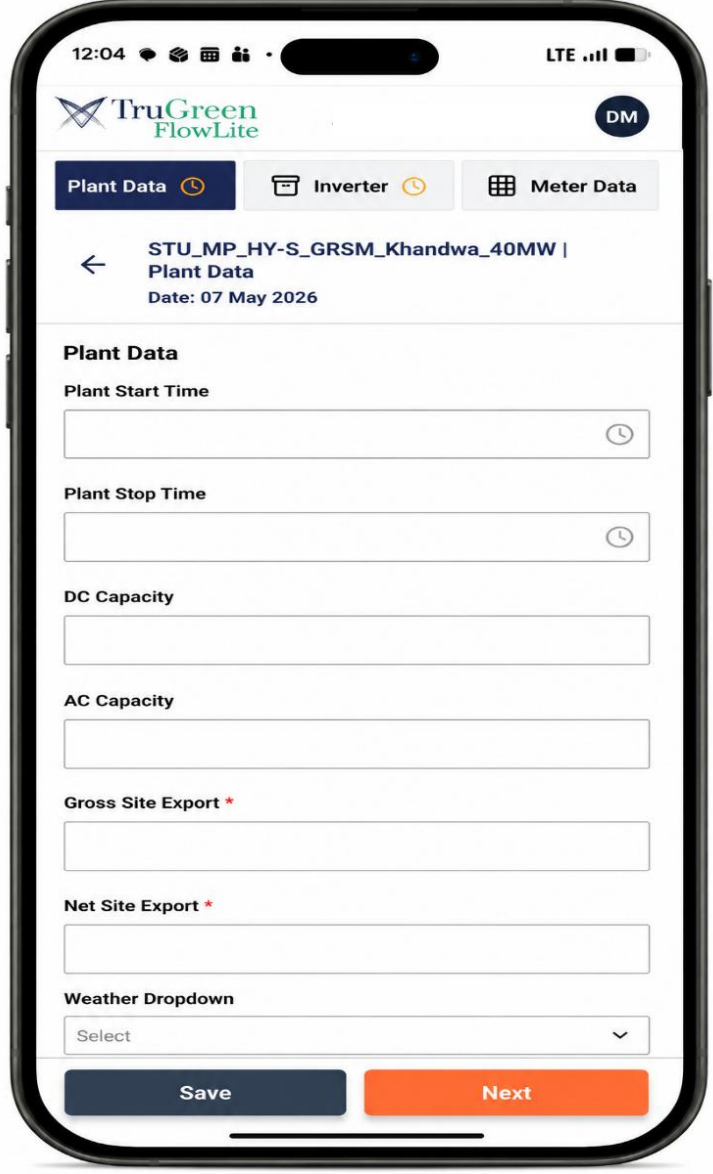
FlowLite standardizes plant reporting across all sites — capturing plant start and stop times, gross and net export values, AC/DC capacity details, weather tracking, and full historical operational logs. No more mismatched formats across sites or vendors.
Downtime Analysis Dashboards
FlowLite tracks equipment breakdown trends, generation losses, MTTR and MTBF insights, fault occurrence patterns, and breakdown contribution analysis — improving operational responsiveness and giving management clear visibility into performance losses.
Portfolio Performance Visibility for Management
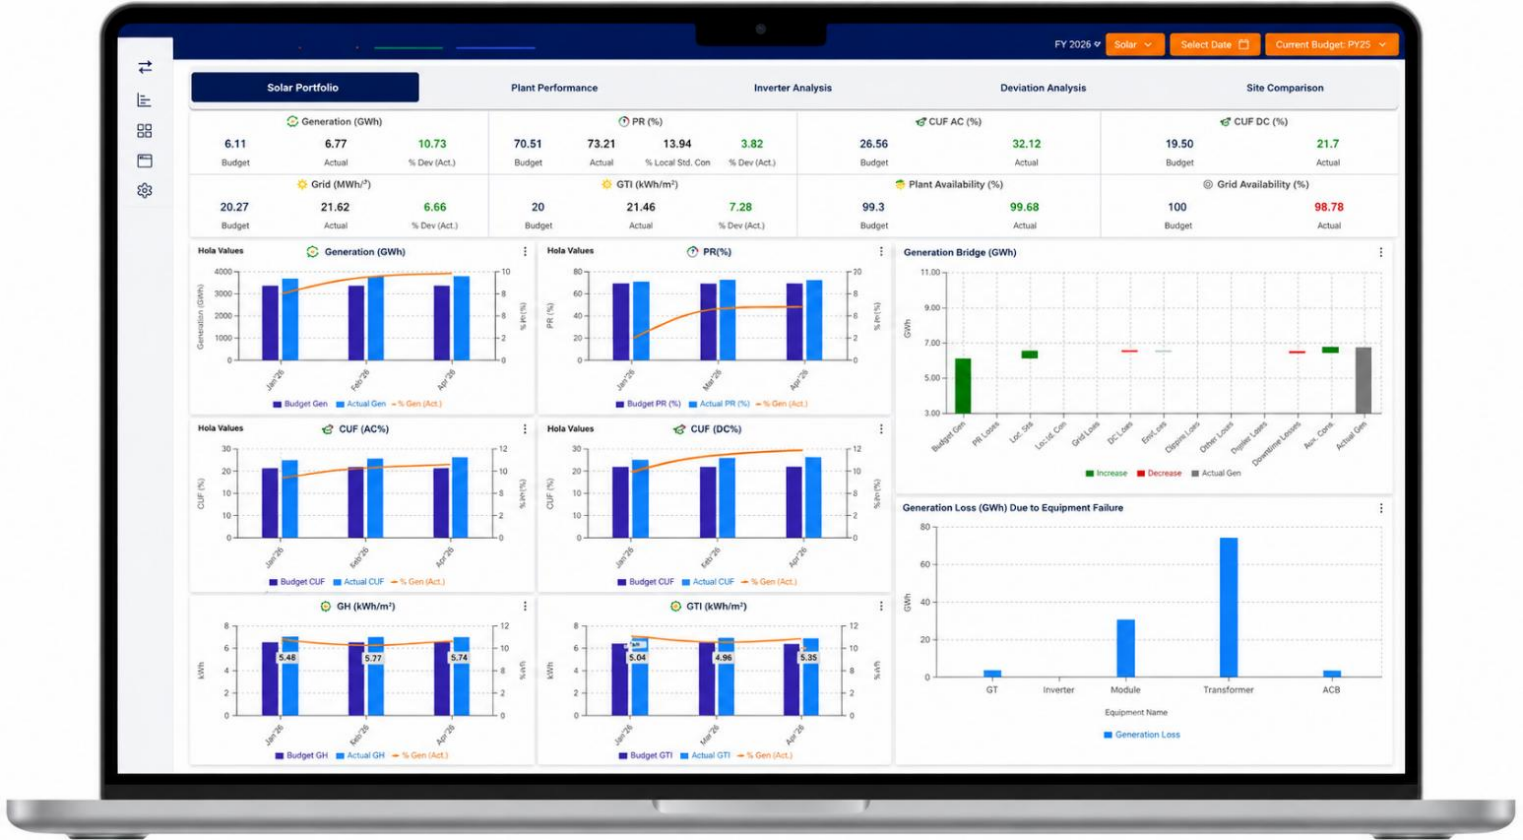
Leadership teams get faster visibility across budget vs actual comparisons, PR analysis, CUF tracking, availability monitoring, generation bridge analysis, and site performance comparison — without waiting for manually consolidated MIS reports.
Inverter Analytics Beyond Spreadsheets
FlowLite enables teams to analyze inverter performance through centralized dashboards — covering PR comparison, inverter health, performance trends, fault patterns, and breakdown impact — helping identify underperforming assets faster and reduce downtime.
Inverter Performance Summary
PR comparison, health heatmap, and breakdown analysis
Mobile-Friendly Field Operations
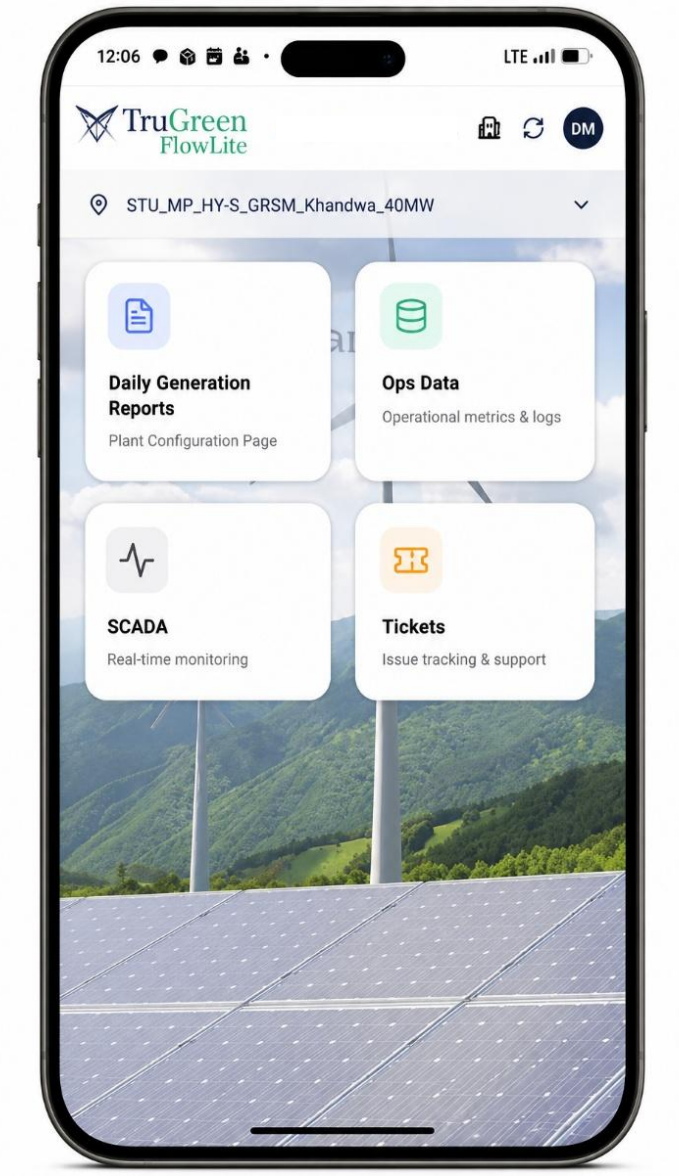
FlowLite enables mobile-accessible workflows for daily generation reporting, plant-level data entry, operational logs, SCADA visibility, ticket management, and workflow approvals — accessible for distributed field teams and remote sites.
FlowLite mobile — DGR, Ops Data, SCADA and Tickets from the field
Mobile plant data entry — field engineers capture data on-site
PR and CUF Tracking Across the Portfolio
FlowLite centralizes Performance Ratio and Capacity Utilization Factor tracking at both plant and portfolio levels — enabling operations and management teams to monitor performance against targets without complex Excel comparison sheets.
AI Assistant TIYA
FlowLite centralizes Performance Ratio and Capacity Utilization Factor tracking at both plant and portfolio levels — enabling operations and management teams to monitor performance against targets without complex Excel comparison sheets.
INDUSTRY SHIFT
The Bigger Shift Happening in Renewable Operations
The renewable industry is gradually moving beyond fragmented reporting systems. Operations teams now require centralized operational visibility, faster reporting cycles, standardized workflows, portfolio-level monitoring, and historical performance tracking that drives data-driven decision-making.
“The shift is no longer only about reporting. It is about building connected operational ecosystems that help renewable companies scale more efficiently.”
FlowLite was built around a very practical operational reality: renewable reporting should not depend on endless Excel consolidation, manual coordination, and fragmented workflows. By centralizing DGR reporting, inverter analytics, operational dashboards, downtime monitoring, and portfolio visibility into one connected platform, FlowLite helps renewable operations teams reduce reporting delays, improve visibility, standardize workflows, and scale more efficiently.
FAQ
Frequently Asked Questions
Q1. What is renewable DGR automation?
Renewable DGR automation helps operations teams streamline Daily Generation Report workflows by centralizing plant and inverter-level operational data, reducing manual Excel consolidation, and enabling faster, more accurate reporting.
Q2. Can FlowLite support multiple renewable sites?
Yes. FlowLite is designed for portfolio-scale renewable operations and supports multi-site operational visibility, standardized reporting, and centralized monitoring across solar, wind, and hybrid portfolios.
Q3. Does FlowLite provide inverter-level monitoring?
Yes. FlowLite enables inverter-level reporting, operational tracking, and performance analysis including generation, PR, faults, and historical trends — all within a centralized platform.
Q4. How does FlowLite help with downtime analysis?
FlowLite provides centralized downtime analysis dashboards that track equipment breakdowns, generation loss, MTTR/MTBF, fault trends, and recovery timelines — helping teams respond faster and reduce losses.
Q5. Can field teams use FlowLite on mobile?
Yes. FlowLite offers mobile-accessible workflows for daily generation reporting, plant data entry, operational logs, and ticket management — making it suitable for field engineers and remote sites.